Show & Tell
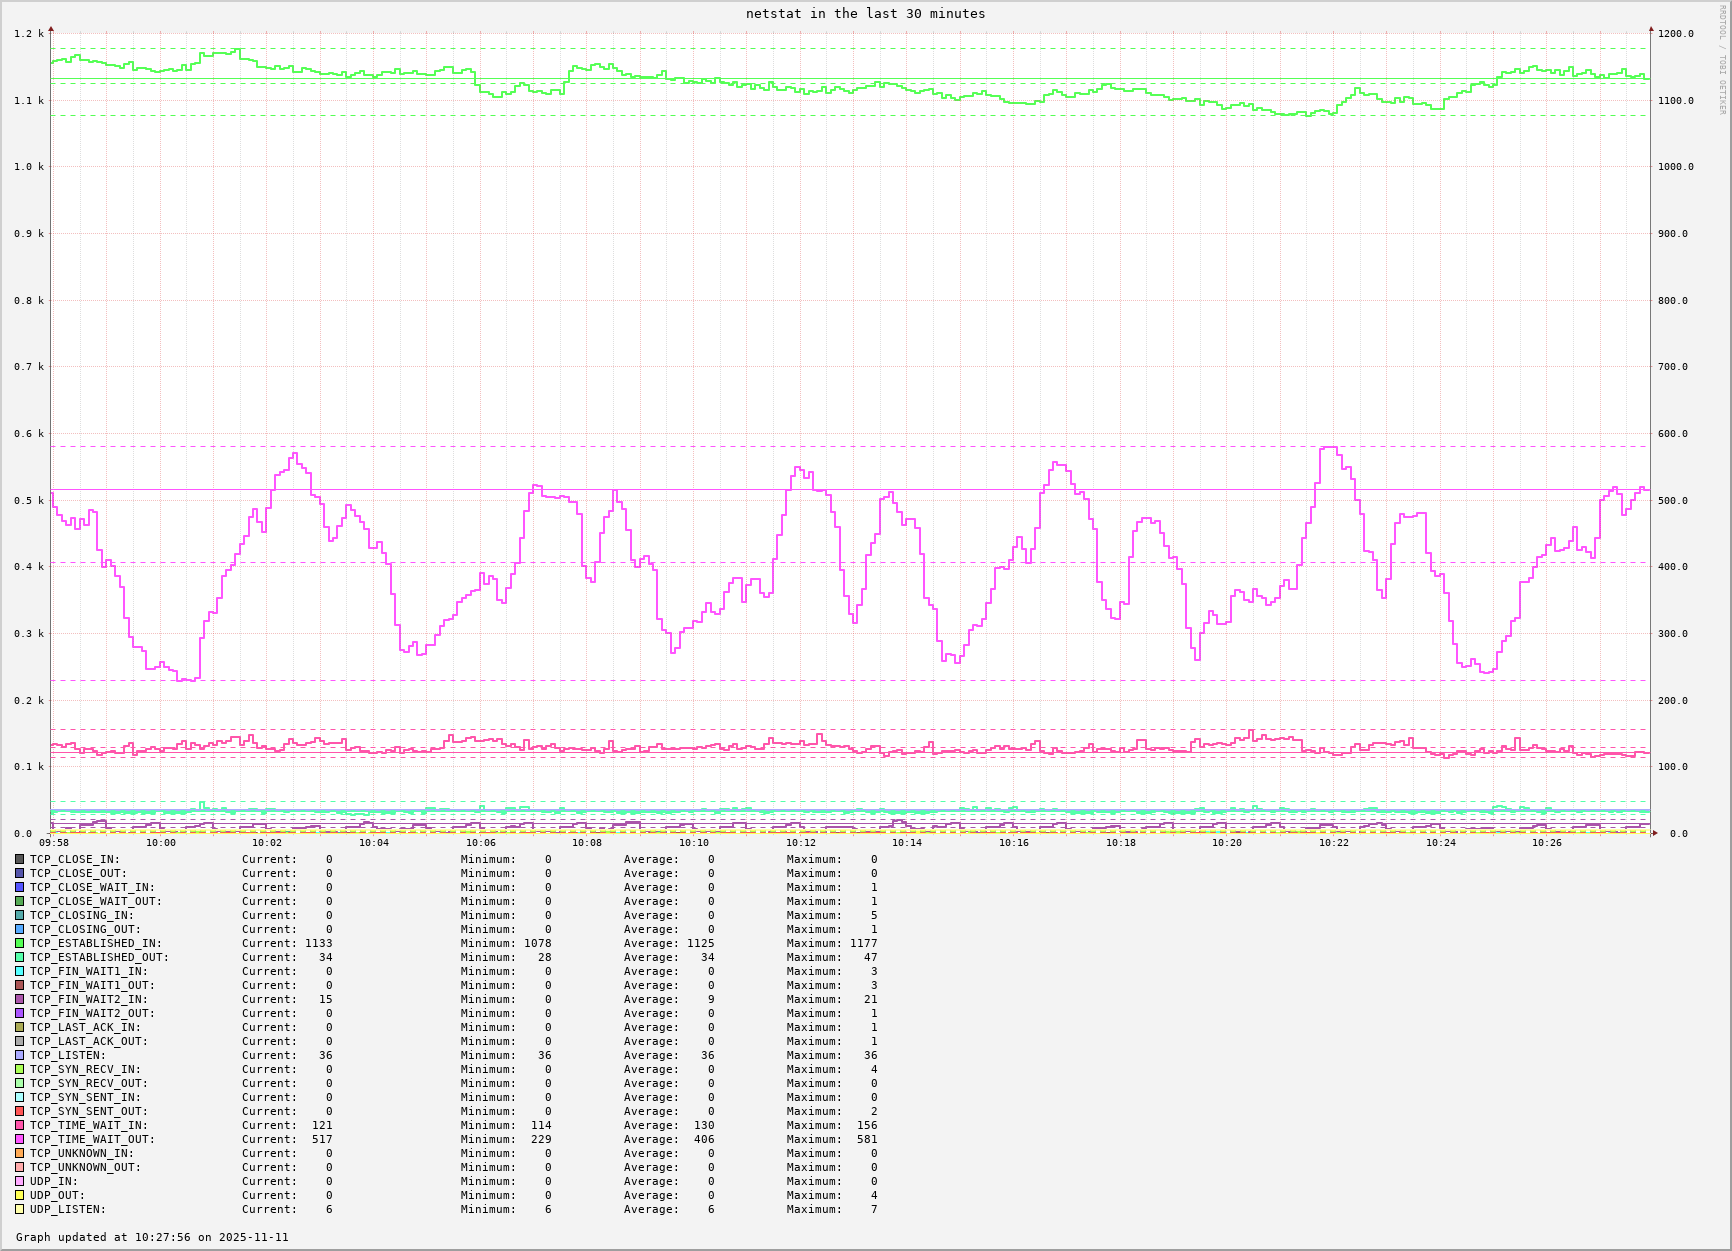
The first two graphs are using RRD's `VDEF` graph command which causes it to compute a value over the data points visible in the graph; e.g. maximum, minimum, average, and then uses an `HRULE` to draw a horizontal line at that computed value. -- I think this makes it a lot easier to see the maximum, minimum, average, and current values anywhere along the graph.
- maximum is the top dashed horizontal line
- minimum is the bottom dashed horizontal line
- average is the middle dashed horizontal line
- the solid horizontal line is the current value
N.B. Click the image to go back to the previous tab.
gearmand number of open file handles in the last 30 minutes