RRD
Round Robin Database
What:
- Round Robin Database is a time series database that makes it easy to store and graph data.
- RRD makes the housekeeping of collection a specific number of data points easier. - Focus on your data and let RRD deal with storing it for you.
Why:
- To assist with diagnostics
- To identify patterns and trends
- So you can see what your numerical data looks like.
When & Where:
- Any time & place that you can benefit from collecting -> recording -> graphing numbers
How:
- Collect the number(s) using the same command(s) you use when actively looking at the output.
- Record the number(s) for later analysis.
- Graph the number(s) to visualize their values over time.
Who:
- Anyone who can benefit from collecting -> recording -> graphing numbers.
- Read: You!
CRG
Collect, Record, and Graph
Suppose that I'm running the following command to monitor a counter:
${COLLECT_COMMAND}
Suppose that the command produces output like the following:
609 4667 342
616 4667 228
623 4667 114
630 4680 0
637 4667 -114
644 4667 -228
651 4667 -342
Hint:
- There is a pattern to it, but it's multiple hundreds of lines of output to see it.
- If you're really good at math, you might be able to decode the numbers using 7, 13, and 19 (in that order).
If you're like me, you're not good enough nor fast enough at math to keep hundreds of lines derived numbers in your head to see the pattern.
So, let's Collect the numbers from ${COLLECT_COMMAND} and Record them so that we can use them later.
${COLLECT_COMMAND} | awk '{system("${RECORD_COMMAND} -field1 " $1 " -field2 " $2 " -field3 " $3)}'
Then once you have some data, graph the data to see if you start to see a pattern.
${GRAPH_COMMAND} ${GRAPH_PARAMETERS}
Ah Ha!!!
Oh! Ah Ha!!!
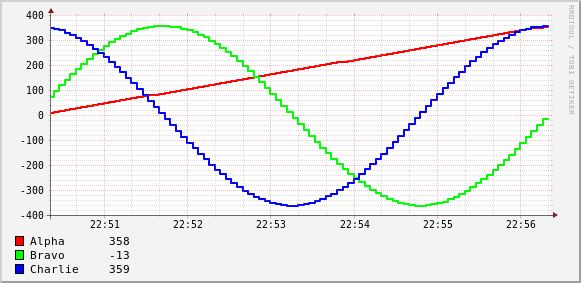
Now a pattern, which may be familiar to some, almost instantly becomes recognizable.
- Alpha is the angle in degrees (multiplied by 7).
- Bravo is the Sine of the angle (multiplied by 13).
- Charlie is the Cosine of the angle (multiplied by 19).
Some of you might have been able to see the pattern if the numbers hadn't been multiplied by an arbitrary number.
I bet that most of you have seen the visual representation of these patterns at some point in the past.
Why the multiplication by primes?
- 1st, by primes because they make number manipulation more interesting and less predictable.
- 2nd, because I wanted to obfuscate the numbers to demonstrate a point.
- 3rd, why not?
Create
Create
Create the RRD file:
rrdcreate sluug.rrd --step 2 DS:alpha:GAUGE:2:U:U DS:bravo:GAUGE:2:U:U DS:charlie:GAUGE:2:U:U RRA:MAX:0.5:2:720
There are a few things going on here:
- specifying the name of the RRD file that we're creating
- specifying the step interval (in seconds) that we expect to see data in
- defining some Data Sources (DS)
- named alpha, bravo, and charlie
- specifying that they are a GAUGE data type
- specifying that if we miss two data points in a row, store it as an Unknown
- specifying that we don't know the lower nor upper bound
- defining a Round Robin Archive
- specifying to use the "MAX" Consolidation Function (CF)
- specifying that if we miss more than 50% of the necessary data points when consolidating, store them as an Unknown in the RRA
- specifying a 2 second step
- specifying how many data points to hold in the RRA
Collect
Collect the data
Collect the data from a convenient command:
./sluug-rrd-presentation-data-collection.sh
This really is do whatever you've been doing to generate -> collect the data.
Record
Record the data:
Do what you've been doing to collect the data, but now cause RRD to record the collected data.
./sluug-rrd-presentation-data-collection.sh \
        | awk '{system("rrdupdate sluug.rrd --template alpha:bravo:charlie N:" $1 ":" $2 ":" $3)}'
This leverages `awk` to glue the same collection command to the `rrdupdate` command in order to record the data in the RRD file.
rrdupdate sluug.rrd --template alpha:bravo:charlie N:1:2:3
- specify the RRD file to work on; sluug.rrd
- specify the template - fields that we're providing and their order; alpha, bravo, and charlie
- specify the actual data
- N is a place holder for the value of the current time, a.k.a. Now
- 1 is the value for the alpha data point
- 2 is the value for the bravo data point
- 3 is the value for the charlie data point
Recording is probably one of the easiest things to do with RRD. Which is good, because `rrdupdate` / recording is likely the most common RRD operation.
Graph
Graph
Now we generate the graph.
   rrdtool \
	graph \
	sluug-rrd.png \
	--start end-360s \
	--height 200 \
	--width 500 \
	\
	DEF:alpha=sluug.rrd:alpha:MAX \
	CDEF:alphaprime=alpha,7,/ \
	LINE2:alphaprime\#FF0000:"Alpha  " \
	GPRINT:alphaprime:LAST:"%5.0lf\n" \
	\
	DEF:bravo=sluug.rrd:bravo:MAX \
	CDEF:bravoprime=bravo,13,/ \
	LINE2:bravoprime\#00FF00:"Bravo  " \
	GPRINT:bravoprime:LAST:"%5.0lf\n" \
	\
	DEF:charlie=sluug.rrd:charlie:MAX \
	CDEF:charlieprime=charlie,19,/ \
	LINE2:charlieprime\#0000FF:"Charlie" \
	GPRINT:charlieprime:LAST:"%5.0lf\n"
Yes, there are a lot of things going on here. No, it's not as bad as it initially looks. Let's take them one step at a time:
- housekeeping for things like:
- specify that we want to create a graph via the `graph` sub-command
- specifying the start time and say that it's relative to the (automatic) end (of data); `--start end-360s`
- specifying dimensions of the graph; `--height 200` & `--width 500`
- Data definition with DEF statements:
- DEFining the graphing variable name (on the left of the equals sign) to reference to the file variable name (on the right of the equals sign).
- Specifying a Consolidation Function of "MAX" - See rrdgraph_data(1) man page for minutia.
- Computation DEFinition with CDEF statements:
- CDEFining the graphing variable name (...) to be the result of the computation applied to the variable (...).
- Yes, that's reverse Polish notation (RPN). - See rrdgraph_rpn(1) man page for minutia.
- In this case, we're assigning the graphing variable to the value of the variable on the right divided it by 7 / 13 / 19 (respectively).
- Plotting a LINE for the current value of the variable:
- Specifying the graphing variable to be plotted
- Specifying the line width of 2 pixels
- specifying the line color
- Print the current value of the variable in the legend
- lather, rinse, and repeat as necessary / desired
Examples
Real world examples:
- Needing to keep track of and visualize how many Nagios tests are in an "Unknown" (3) state while diagnosing a problem on a server you inherited.
- Needing to keep track of and visualize connection latency while diagnosing ....
- Needing to keep track of the number of TCP connections in various states and directions while diagnosing ....
- Demonstrating some capabilities to compute values while graphing when raw data may be a little too obvious.
T.P.
Talking points:
- Most of the graphing that I've done has just used the DEF, LINE, and GPRINT statements.
- This presentation is the first time I've used CDEF statements. -- I added that for SLUUG because I'm a BOFH. }:-)
- I try to keep my variable names consistent throughout; RRD file data point names, variable definitions, etc., to make things simpler for me.
- I've used RRD multiple times over the last two decades.
- I've used RRD extensively over the last two weeks.
- Many programming languages have interfaces to RRD. E.g. I have Perl scripts; <thing>-collect.pl, collecting data and recording it in an RRD file.
- I tend to put my `rrdtool graph` commands in a script; <thing>-graph.sh, so that I can have more flexibility / easy of management.
- I (sequentially) run multiple collection & recording scripts in a loop from a collection wrapper script with a one second delay (sleep 1).
- I (sequentially) run multiple graphing scripts in a loop from a graphing wrapper script with a one minute delay (sleep 60).
- I have an HTML page with a <meta http-equiv="refresh" content="60"> tag to reload new graphs once a minute.
- I find the data collection to be the hardest thing when starting to collect, record, and graph new things. This is because it's a question of how do I get the numbers I want out of wherever they are so that I can put them into something that I can work with. Getting the data out of wherever it is, or collecting, is often the biggest unknown. Sometimes it's code that queries a MySQL database (maybe for counts of services in a desired state) and other times it's parsing the output of a command. -- Once I have the discrete numbers in (some form of) a variable that I can work with, it's relatively trivial to record them into the RRD file.
- Yes, graphing can be tedious. But it's only tedious, it's not hard. Most graphs are a rehash / permutation of a previous graph and can be copy pasted without much work.
- 10 - copy
- 20 - paste
- 30 - tweak
- 40 - GOTO 10
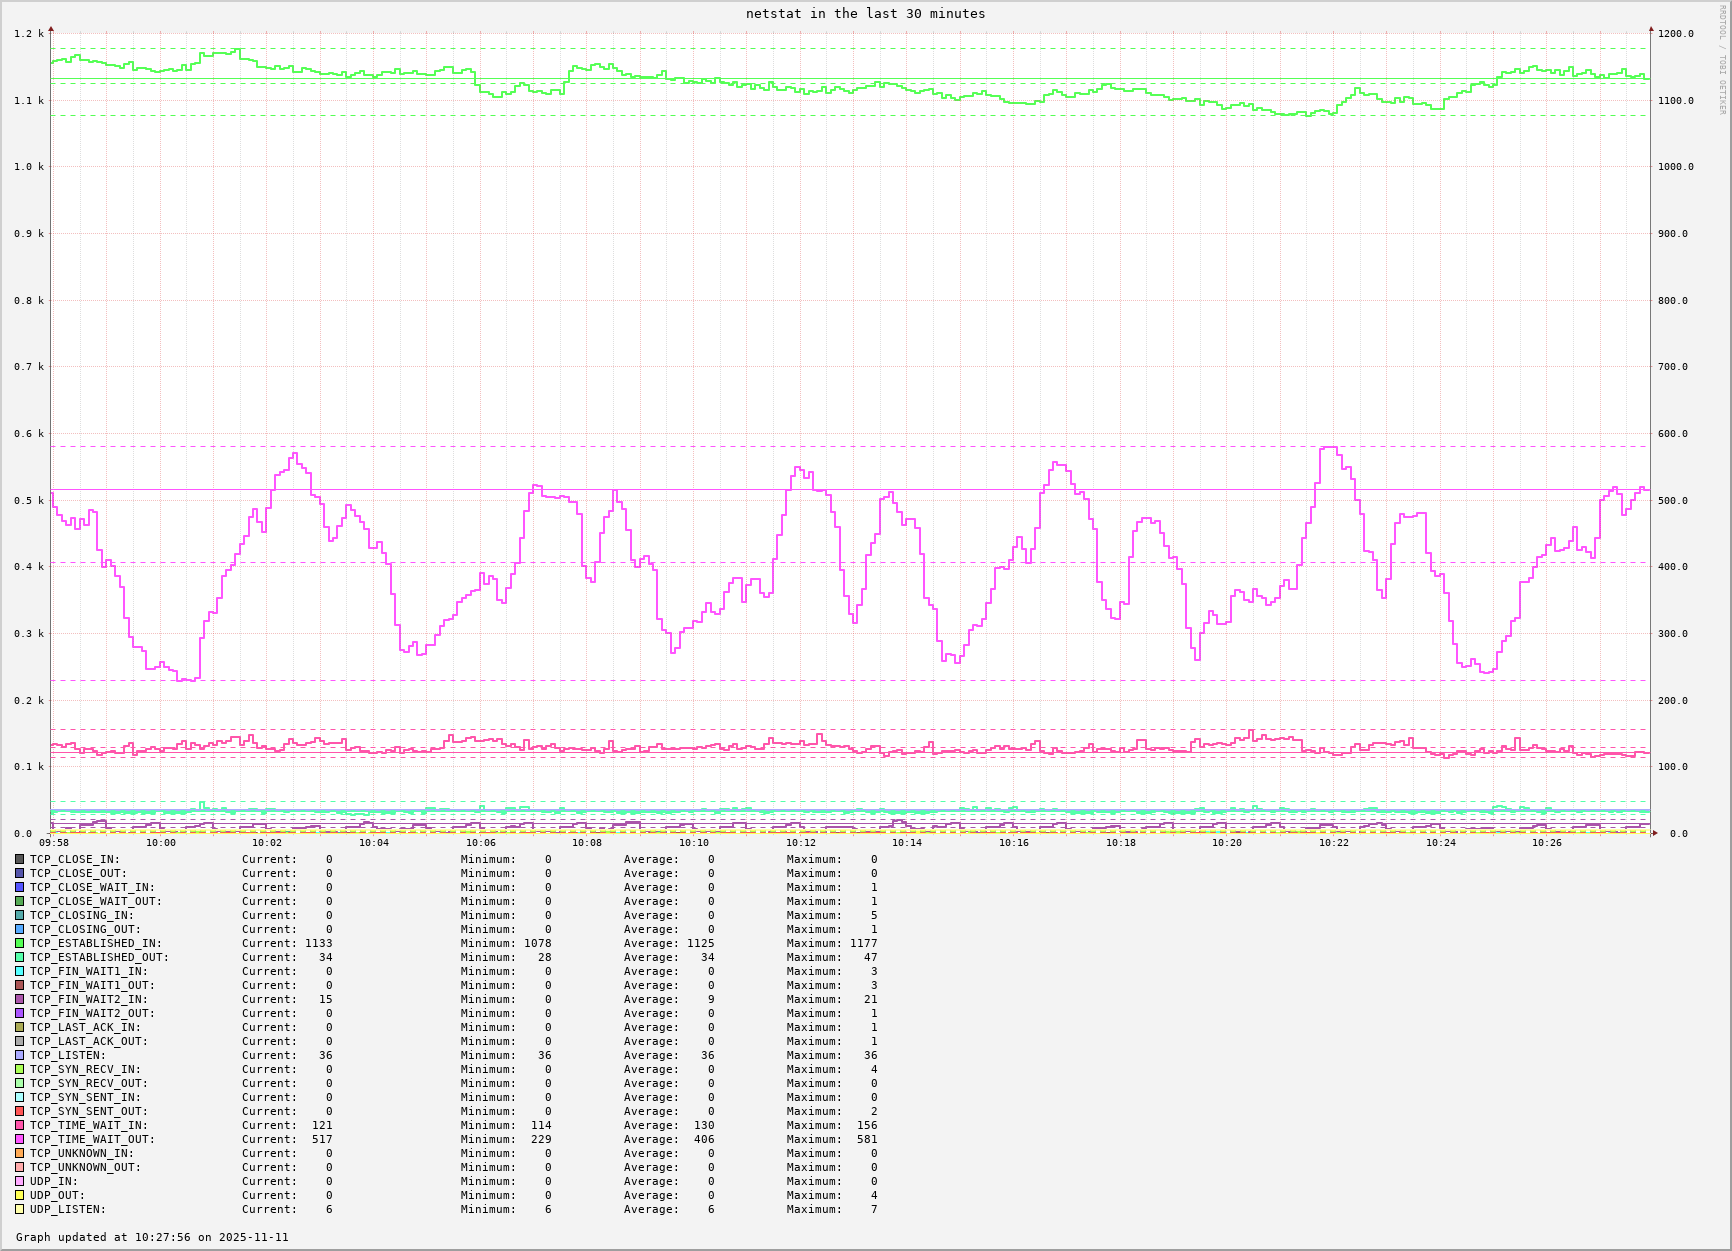
- I FINALLY broke down and created a (Perl) script to parse the output of `netstat` to count the number of connections in various states and directions; inbound, outbound, listening. This collection script by far took the most amount of time out of the collect, record, and graph cycle. This RRD file holds 27 primary data points.
- I hear Lee thinking loudly "Why `netstat` over `ss`?". Very simply I want to be able to run the data collection on more than just Linux; e.g. Solaris, AIX, FreeBSD, SCO OpenServer. `netstat` is nominally universal, save for the Linux Young Bucks that
think they knowdon't know any better. - `netstat` vs `ss` vs anything else is really independent of and outside of the collect, record, and graph cycle. Collect data from whatever tool / command you want to use, record the data, and ultimately graph the data.
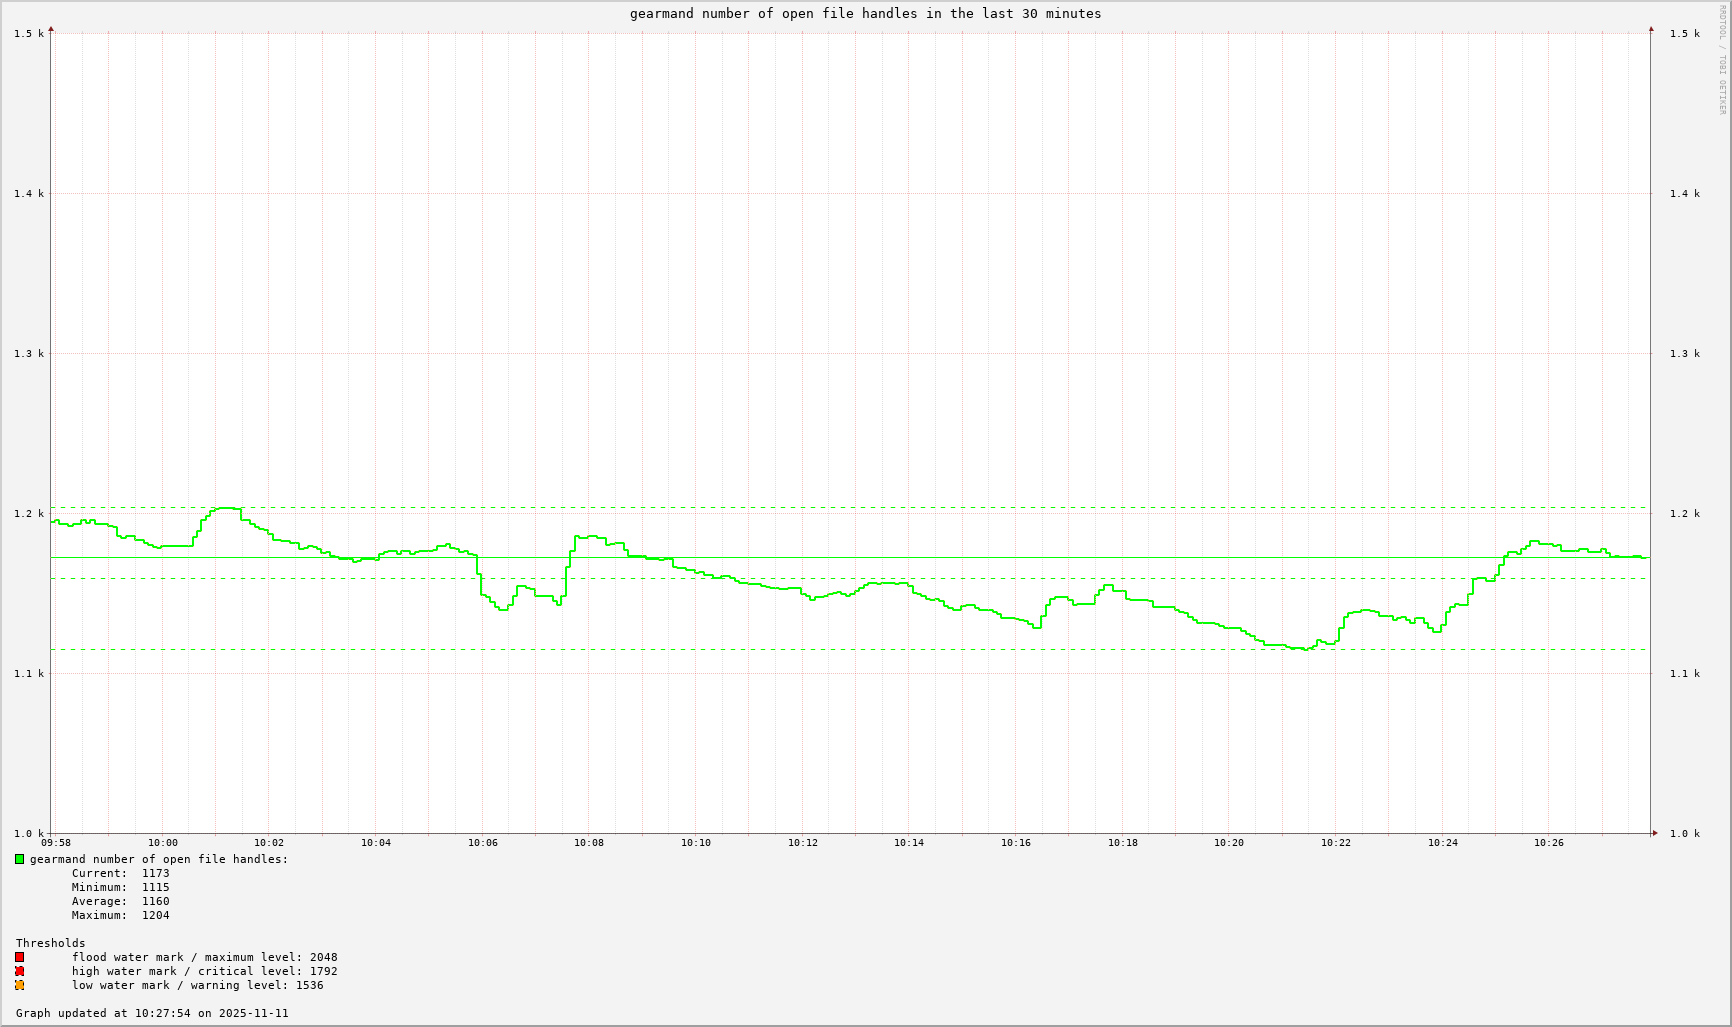
- I created another pair of collection & recording and graphing scripts to save and graph values from `gearman_top` while I'm not looking at the screen. This RRD file holds 63 data points.
- It's often a LOT easier to recognize data visually than just looking at numbers flowing by on a screen.
- If you can get a number out of something, you can almost certainly collect, record, and graph that number's value over time.
S & T
Show & Tell
The first two graphs are using RRD's `VDEF` graph command which causes it to compute a value over the data points visible in the graph; e.g. maximum, minimum, average, and then uses an `HRULE` to draw a horizontal line at that computed value. -- I think this makes it a lot easier to see the maximum, minimum, average, and current values anywhere along the graph.
- maximum is the top dashed horizontal line
- minimum is the bottom dashed horizontal line
- average is the middle dashed horizontal line
- the solid horizontal line is the current value
N.B. Images are scaled to fit, click to see larger images.
gearmand number of open file handles in the last 30 minutes
netstat in the last 30 minutes
gearman_top* in the last 30 minutes
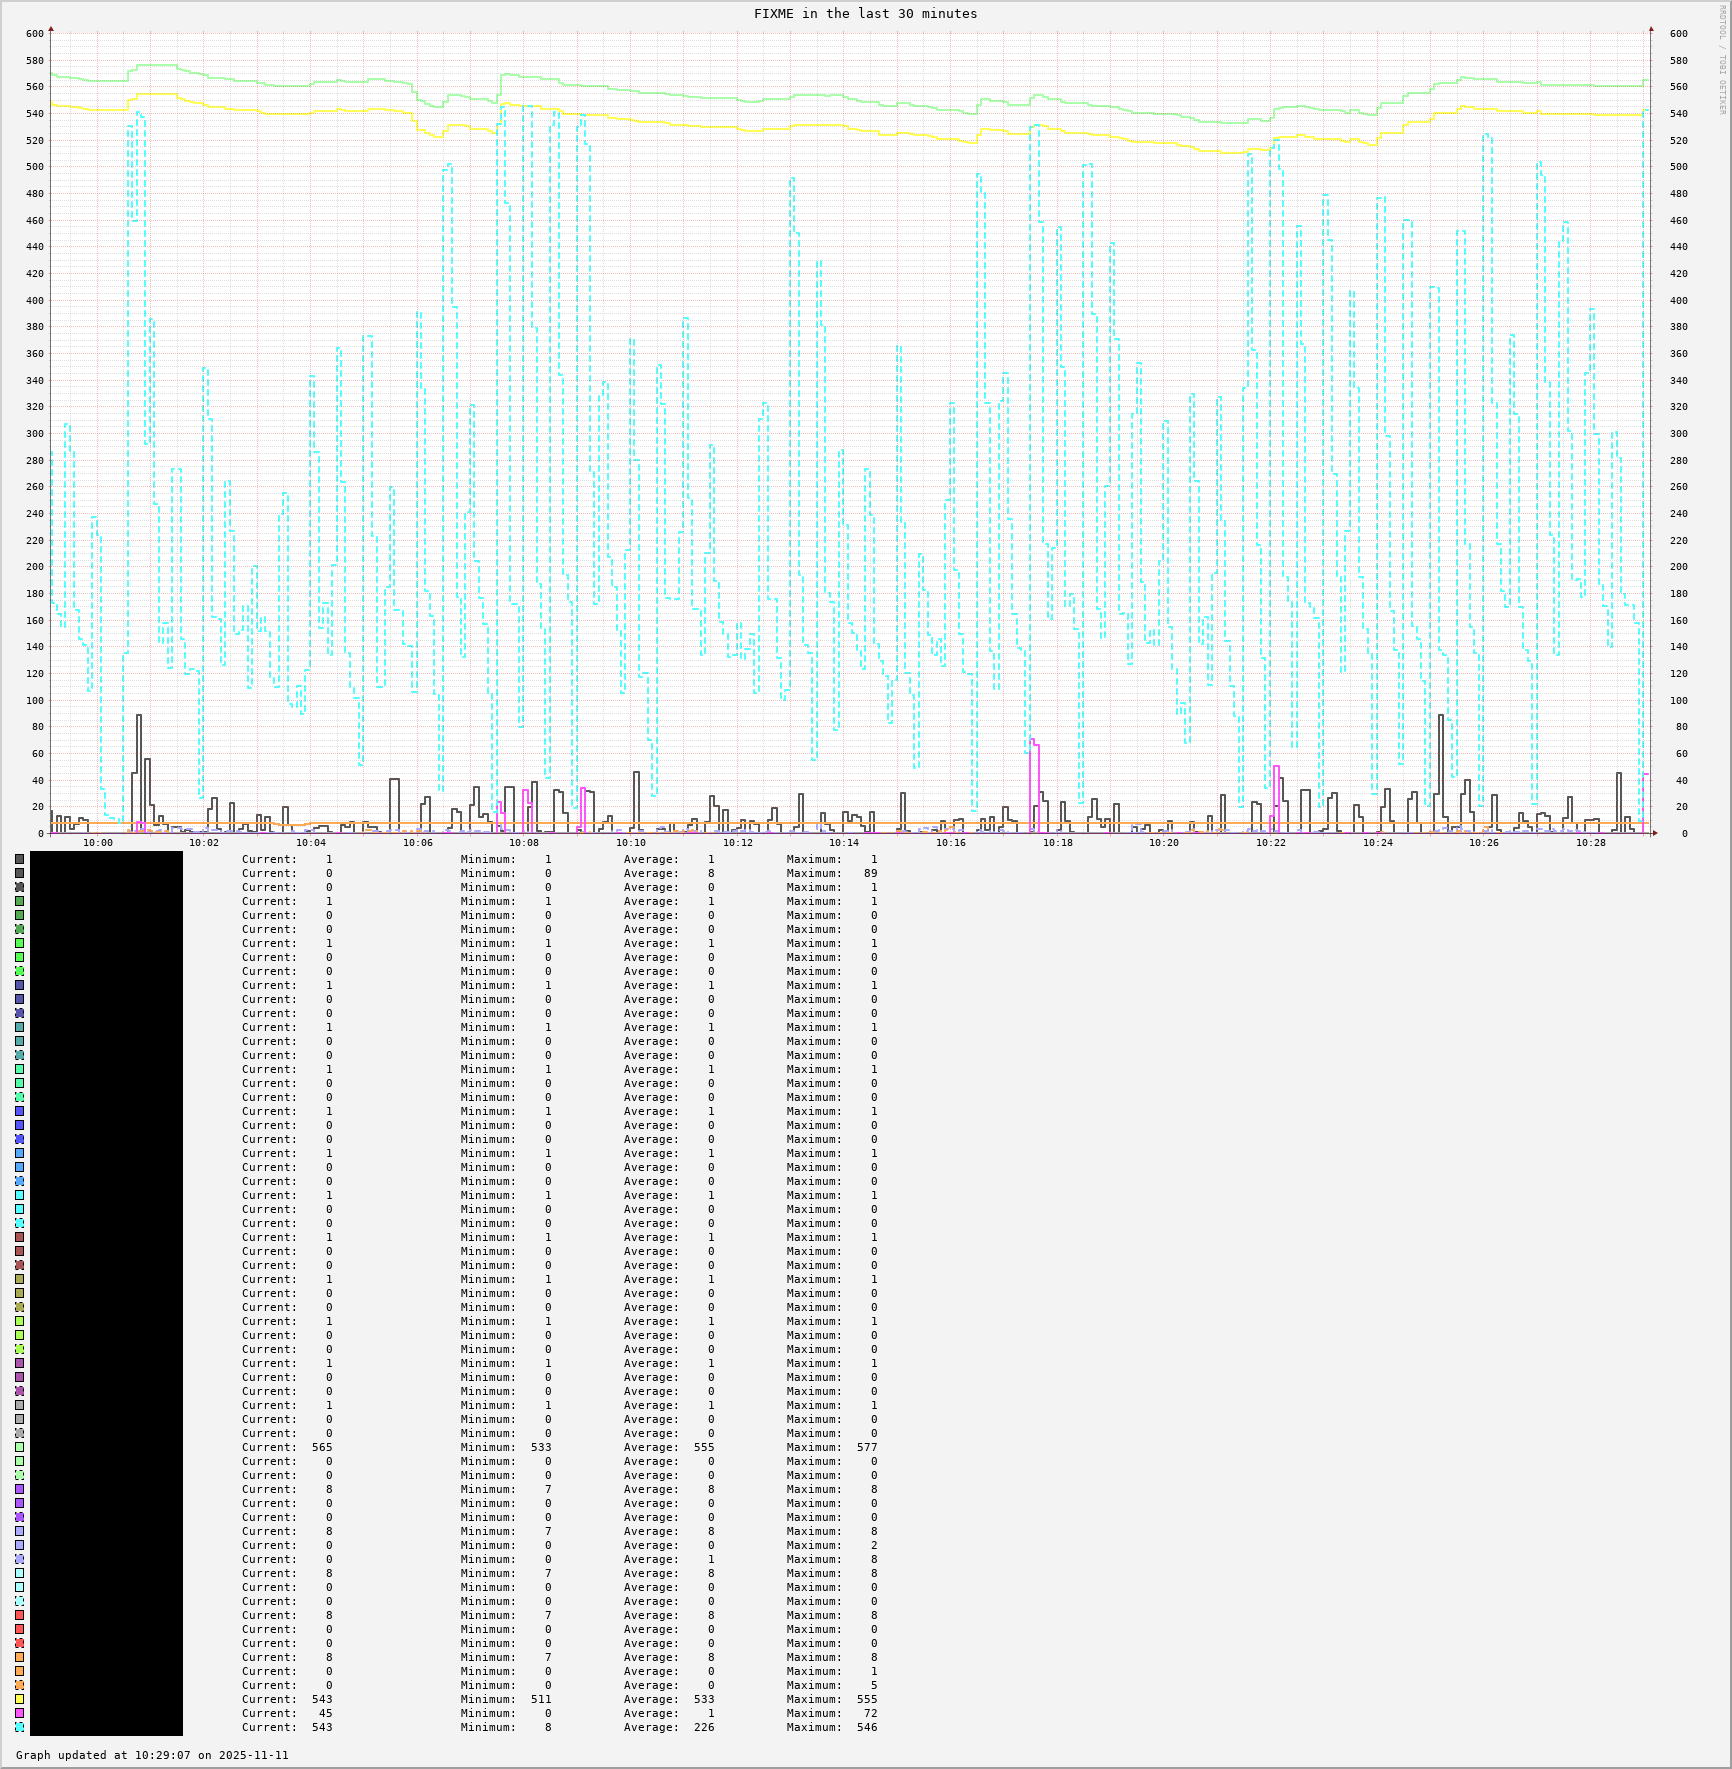
* Yes, I know that the title is wrong. This graph is very much still a work in progress.
Q & A
-
Questions
-
Answers
-
Discussions